How to understand and measure cognitive differences
Measuring neurodiverse traits like cognitive differences requires the same standard practices that scientists use to measure many different things about people. Our understanding of neurodiversity, like any other type of diversity, comes from firstly understanding individual's traits and then identifying where they naturally fit within a population sample or data set.
We would like to share some of the fundamental tools we use, which can help you to understand our methodology.
What are standard scores?
Standard scores are a tool commonly used by scientists to help understand and communicate many measurable differences within a population. Standardising scores on any task or measurement allows us to do 3 things:
Compare one person’s scores on different tasks that have different scales
Understand where an individual sits in comparison to a population
Adjust for important factors such as age
All of these steps are crucial for understanding cognitive differences and what indicates a significant learning need. We’ll cover each step-in turn.
1. Comparing scores on different tasks
In the Cognassist cognitive assessment, many of our tasks are measured in different ways. Some tasks will have a different set number of questions and others have no set limit but measure the maximum responses of each individual. We need to be able to compare all of these scores for one individual.
As an example, if you are told that Nazanin scored 37/78 on task A and 46/102 on task B. How is Nazanin doing on task A compared to task B? On the face of it, it’s hard to tell and you would need to do some additional calculations.
If instead you were told that Nazanin had a standard score of 100 on test A, and a standard score of 120 on test B, you can immediately tell that Nazanin is doing better on test B than test A because the scores have been transformed to be on the same scale. No additional information is needed to compare Nazanin’s performance in different areas if you have her standard scores.
2. Understanding where an individual sits in comparison to a population
To understand how and why we use standard scores to identify learning needs, we need to quickly touch on how these scores are distributed within a population. The shape of the graph below (Figure 1) is a representation of a “normal distribution”. When we measure and collate scores on most human characteristics, such as height, birth weight, heart rate or cognition, we tend to see this curved shape.
Figure 1: A Normal Distribution
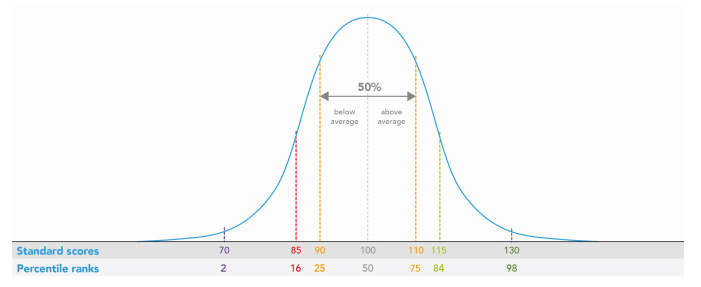
It turns out that most people score in a similar range on most characteristics – indicated by the bump in the middle of the curve on the graph, where you can see the grey arrows. As scores move away from the middle of the graph, in either direction, we see them less and less often – hence the curve tapers off. Scores at the extremes become less probable. For example, if we go out and measure height, we find fewer tall people than people of average height, and even fewer really tall people.
All of these scores form a normal distribution, it is not saying that "normal" people are the ones represented in the middle of the graph. Diversity is a normal part of life, no one person is exactly the same so "normal" doesn't really exist, just similarities and, yes, some differences too.
When scores are normally distributed, we calculate both the mean and the standard deviation for each individual task. To standardise the scores for each task, we assign a standard score of 100 to represent the mean (you can see 100 is in the middle of Figure 1). We also assign 15 to represent the standard deviation on each task or measurement. We’ll explain more on standard deviations and their importance shortly.
Assigning standard scores to normally distributed data in this way allows us to answer questions like, “is Andre tall or short?”. There is no user manual for human beings, telling us about an objective threshold regarding what counts as tall or short. We would need to compare Andre’s height to the rest of the population. If he is taller than 80% of the population, we can certainly say that he is tall.
Cognition and neurodiversity are similar to height in this way. For example, to understand if Malcolm’s verbal memory is disrupted, we must ask, “what percentage of people remember more or less verbal information than Malcolm?”
Standardising scores from a verbal memory task and seeing where this score is on the normal distribution enables us to see if Malcolm’s verbal memory is higher or lower than others in the population.
3. Adjusting for important factors like age
We’ve covered why we need to compare an individual’s score within a population to better understand their abilities. In other words, the threshold for measuring neurodiversity is always relative. But how do we decide who to compare people to? Do we compare an individual to everybody in the population?
The crucial factor here is age.
As an example, it is common for our information processing speed to peak in our mid-20s, then gradually slow down from there (sad but true). This means that to see whether your cognition is different, we need to compare you to people of your own age because the expected range changes for each age group.
The graph below (Figure 2) includes Cognassist’s data. It shows how one of our domains, Visual Information Processing Speed (VIPS), changes in people of different ages.
Figure 2: visual information processing speed at different ages
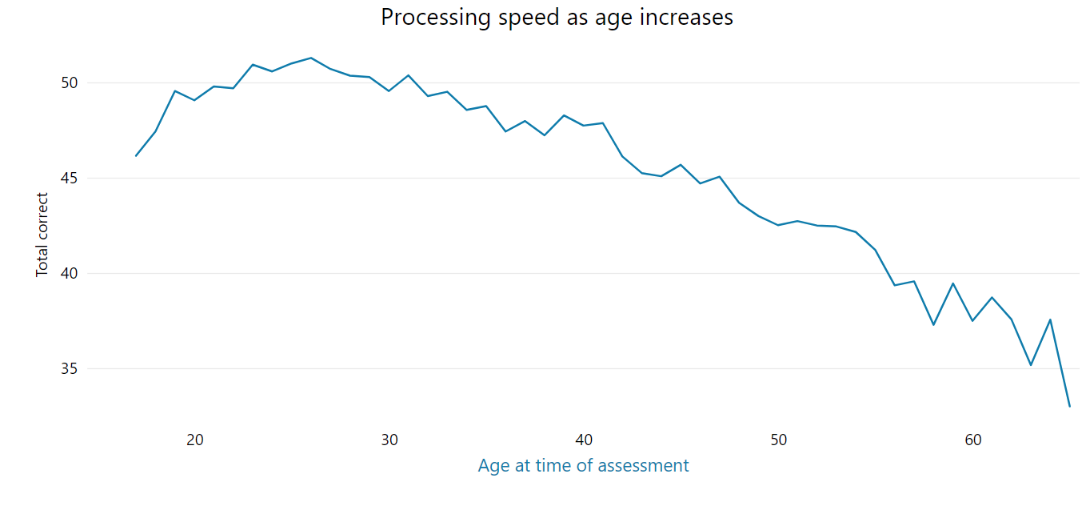
As we expect, the peak is around mid-20’s, then tapers off (this is one way we know that this task is working properly – it matches decades of research). Looking at the graph, it would be inaccurate to compare someone aged 50 to someone aged 30. The 50-year-old will probably score lower, but not necessarily to a level that is unexpected.
A 30-year-old could get 110 questions right on the VIPS domain, which could be a standard score of 85. But a 50-year-old could get 80 VIPS questions right, also reflecting a standard score of 85. Because the average range, and one standard deviation either side of the mean, are specific for each age bracket.
It is obvious that we should not compare children of different ages or children with adults. But it is less obvious that the expected range of cognition for adults changes over time in an expected way too.
This also explains why inputting an accurate date of birth when setting up a learner is crucial for standardised scores to be accurate. To identify where people need support, we should ask the question, “Is our score different when compared to other people like us?”
How do we use standard scores to identify a significant learning needs?
This is where standard deviations become important. A standard deviation can be thought of as the most common amount that people differ from the average on any given task (or the standard amount that people deviate from the mean). On any given measure, most of us score about the same, but we don't all score exactly the same – we score somewhere around, or close to, the mean. The standard deviation tells us this common range.
As we mentioned previously, when using standard scores, we assign a standard score of 100 to the mean on a task or measurement and assign 15 to the standard deviation (a standard score, or mean, of 100 minus a standard deviation of 15 = a standard score of 85). Therefore, a score below one standard deviation from the mean (84 or below) is used to indicate a significant difficulty.
If a person's score is lower than one standard deviation below the mean, that person is performing well outside the usual range around the mean. In other words, they may find the relevant type of task significantly more difficult than the majority of other people and are therefore at a disadvantage and should be offered support. A standard score of 84 or lower is not simply “below average”, it indicates a score that is lower than 86% of the population and should not be ignored.
One standard deviation below the mean is commonly used as a statistical threshold to suggest a substantial need and is recommended by the World Health Organisation, American Psychological Association and the Joint Council for Qualifications (JCQ) in the Access Arrangements and Reasonable Adjustments regulations.
If you sit outside this common range, it is not something to cause worry or feel bad about. The aim is to prevent any disadvantage, and the differences and difficulties you may experience will not be a barrier to your success with the right support. Our cognition is remarkably diverse, you may score lower in some domains but excel in others. Our strengths are just as important as the areas where we need support.
What are percentile ranks?
Standard scores can be directly translated into percentile ranks. For example, a standard score of 100 is always equivalent to a percentile rank of 50 (50% of people score higher than you, 50% below). A standard score of 85 is always equivalent to a percentile rank of 16 (84% score higher, 16% below).
Percentile ranks help us think about the probability of a score and any differences between scores. For example, it is easy to think that there is nothing much between a standard score of 85 and a score of 90, but a person scoring 90 is scoring higher than 25% of the population, whereas the person scoring 85 is only scoring higher than 16% of the population. This is a 9% difference that can be significant when it comes to day to day activities.
Caution should be used in an educational context when interpreting scores lower than 85, which is already conservative – indicating the 16th percentile. For example, a score of 81 might seem just below the threshold of 85, but if we think about the relevant percentile rank, it equates to a score that is lower than 90% of the population, a significantly low score. If your cholesterol is higher than 90% of the population, you would likely receive immediate support from your physician.
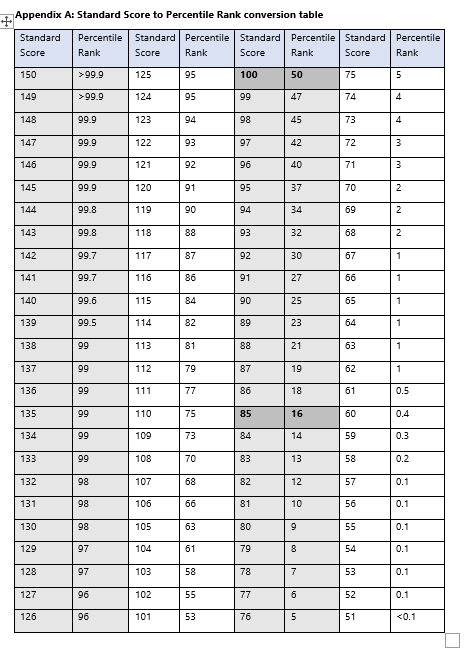
Note: See Appendix A for a useful table to convert standard scores to percentile ranks.
Why are both percentile ranks and standard scores useful?
Although they are mathematically equivalent, percentile ranks tell us where a score is in relation to other people and standard scores help us to think about where the most common range of scores is.
Using the example of the weight of babies at birth may help tie all of this information together. If we collate measures of weight at birth for all babies on a graph, the result will be normally distributed (like Figure 1). So, if an individual baby’s weight is at the 25th percentile, we could give their weight a standard score of 90. We can immediately tell two things:
From the percentile rank: The baby's weight is below average, in fact 75% of babies weigh more, 25% weigh less
From the standard score: Even though the baby's weight is below average, it is still within a common range of one standard deviation on either side of the mean (between 85 and 115)
We can interpret percentile ranks and standard scores for cognition in the same way. For cognitive measures, both percentile ranks and standard scores help us think about a person's strengths and challenges in relation to a wider population and whether this person would benefit from support.
Where else are standard scores used?
There are standardised tests and scoring throughout our education and healthcare systems. They are used to determine where someone is compared to other people of the same age level. Standardised test scores should never be used in a bad way for you, or make a learner to feel inadequate, but as a key to know where you/they are and as a starting point to achieve and succeed.
This is the same with the Cognassist cognitive assessment. It is a starting point, indicating how a person thinks and learns. It can be used to introduce key strategies to help someone achieve and succeed, where previously they may have had difficulties, or simply to show areas that are stronger than others. For example, lower verbal memory or literacy scores could be supported by relying on visual learning strategies such as diagrams, flow-charts and mind-maps, if visual perception scores are higher. Standard scores allow us to use an individual’s strengths to help support other areas of need.
All of us are different, and we want to use accurate scientific practices to help transform outcomes, create greater inclusivity and improve people’s lives.
Also other types of standardised scores you may have heard of: z-scores, deciles, t-scores, scaled scores, or even A-B-C marks